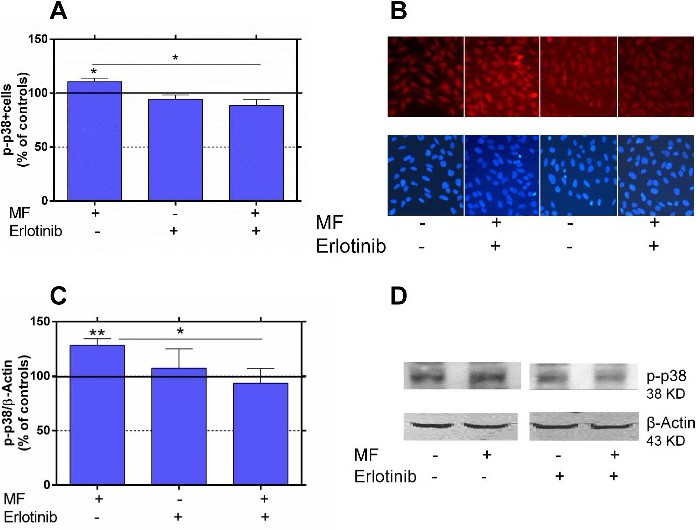
Fig. 4. Effects of 20 min of MF exposure on the rate of p-p38+ cells and on p-p38 protein expression, in the presence or absence of erlotinib. (A) Rate of p-p38+ cells. Immunofluorescence quantification by computer-assisted analysis of photomicrographic images: normalized values. *: 0.01 ≤ p <0.05 (ANOVA and Student's t-test). (B) Upper panel: representative images of p-p38 labeling. Lower panel: Hoechst-stained nuclei of the cells in the corresponding upper micrographs. (C) Western blot quantification of p-p38 expression. β-Actin was used as charge control. Values are normalized over controls. Bars are means ± SEM of 5 experimental replicates, with 3 samples per experimental condition and replicate. *: 0.01 ≤ p <0.05; **: 0.001 ≤ p<0.01 (Student's t-test). (D) Representative blots for p-p38.